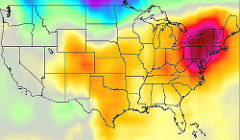
This sample contextualized lesson is a Level A adaptation of the original Heat Wave lesson which can be found here. The context for this lesson is climate and climate change, and it focuses on comparing sets of data, specifically the number of heat wave days in Massachusetts in the years between 1981 and 2010 (as recorded by the Center for Disease Control).
Lesson objectives:
- find the median and range of a data set, and identify these as measures of center and spread
- informally describe the shape of a data set using a dot plot
- informally make comparisons between data sets based on median, range, and shape
- experience using long term weather data to look for climate trends
The lesson includes a lesson plan and teacher materials as well as student materials/handouts.
Topic Area
CCRSAE (College and Career Readiness Standards for Adult Education)
Digital Literacy
Math & Numeracy
Science
Media Type
Document
Resource Type
Curriculum
PD Team
SABES Mathematics and Adult Numeracy Curriculum and Instruction PD Team
